- Solid-phase peptide synthesis builds a chain one residue at a time, so a small per-cycle failure rate compounds across the whole sequence.
- Deletion sequences, also called n-1 impurities, are missing one internal residue after a coupling step fails.
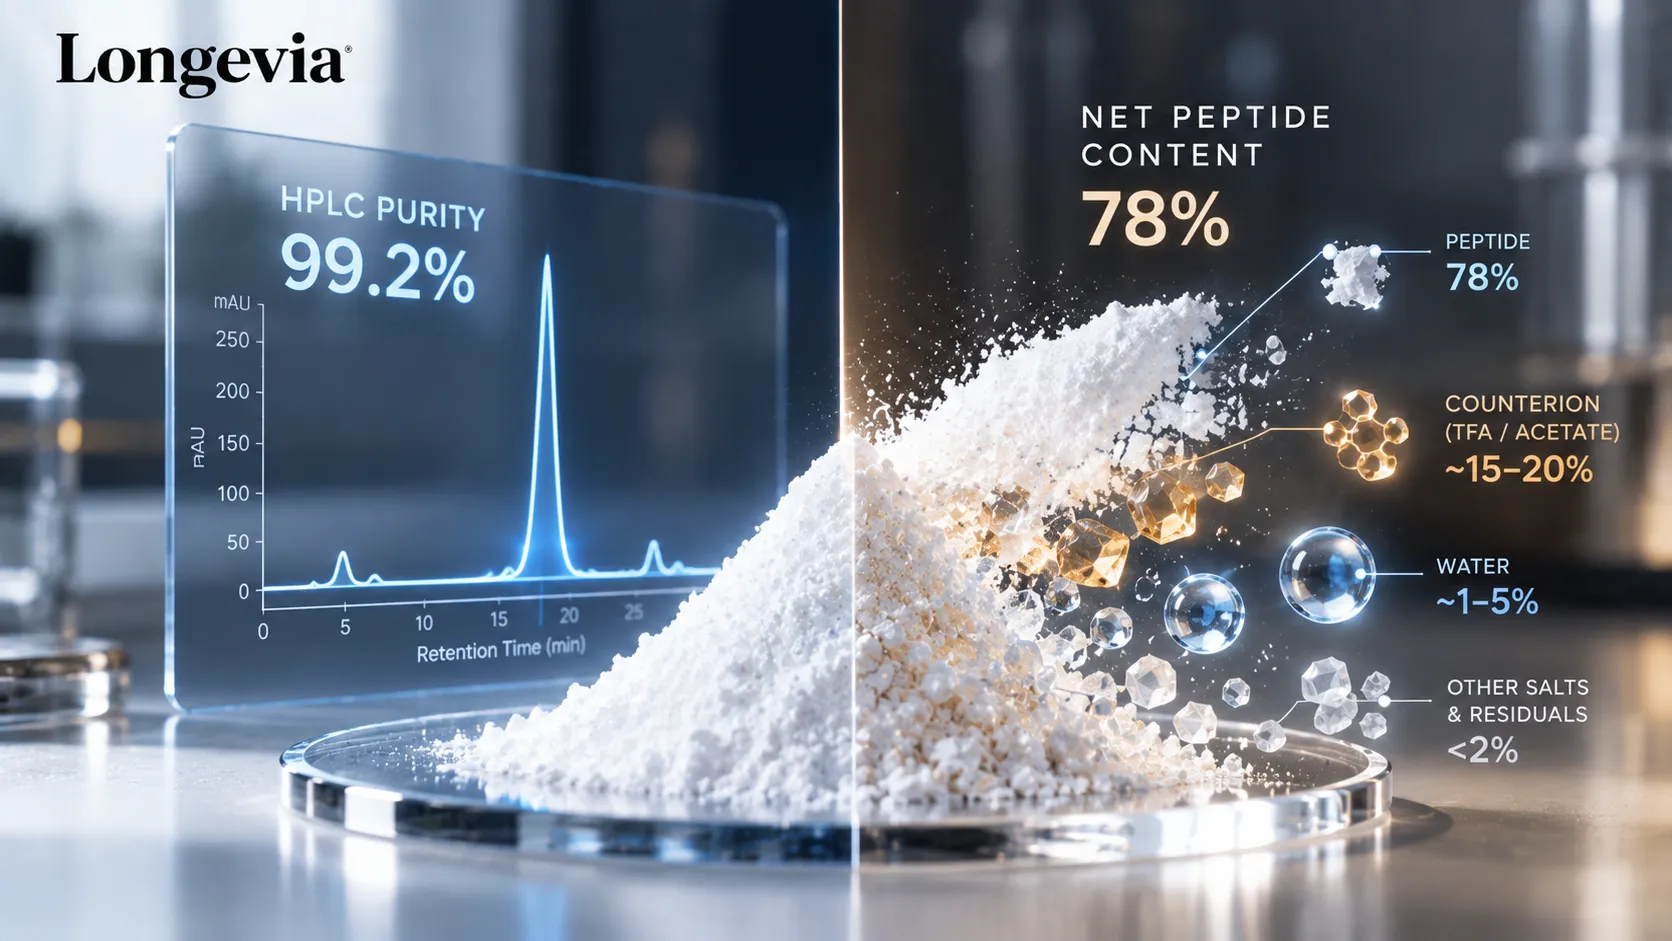
- HPLC purity is the main peak's share of the UV signal, not the sample's mass composition.
- A co-eluting impurity integrated inside the main peak does not lower the reported purity figure.
- LC-MS assigns a mass to each peak, which confirms composition but not the order of the residues.
- Epimers and isobaric residue swaps weigh the same as the target and cannot be told apart by mass alone.
- A fixed 1 Da tolerance on a 3,000 Da peptide is near 333 ppm and can hide a 0.984 Da deamidation shift.
- MS/MS reads sequence order from gaps between fragment masses, and it is absent from most routine COAs.
In solid-phase synthesis, a peptide chain is built one amino acid at a time. Every cycle has a small failure rate. At 99.5% efficiency per cycle, a 30-residue chain finishes intact about 86% of the time. The rest of the material becomes something else.
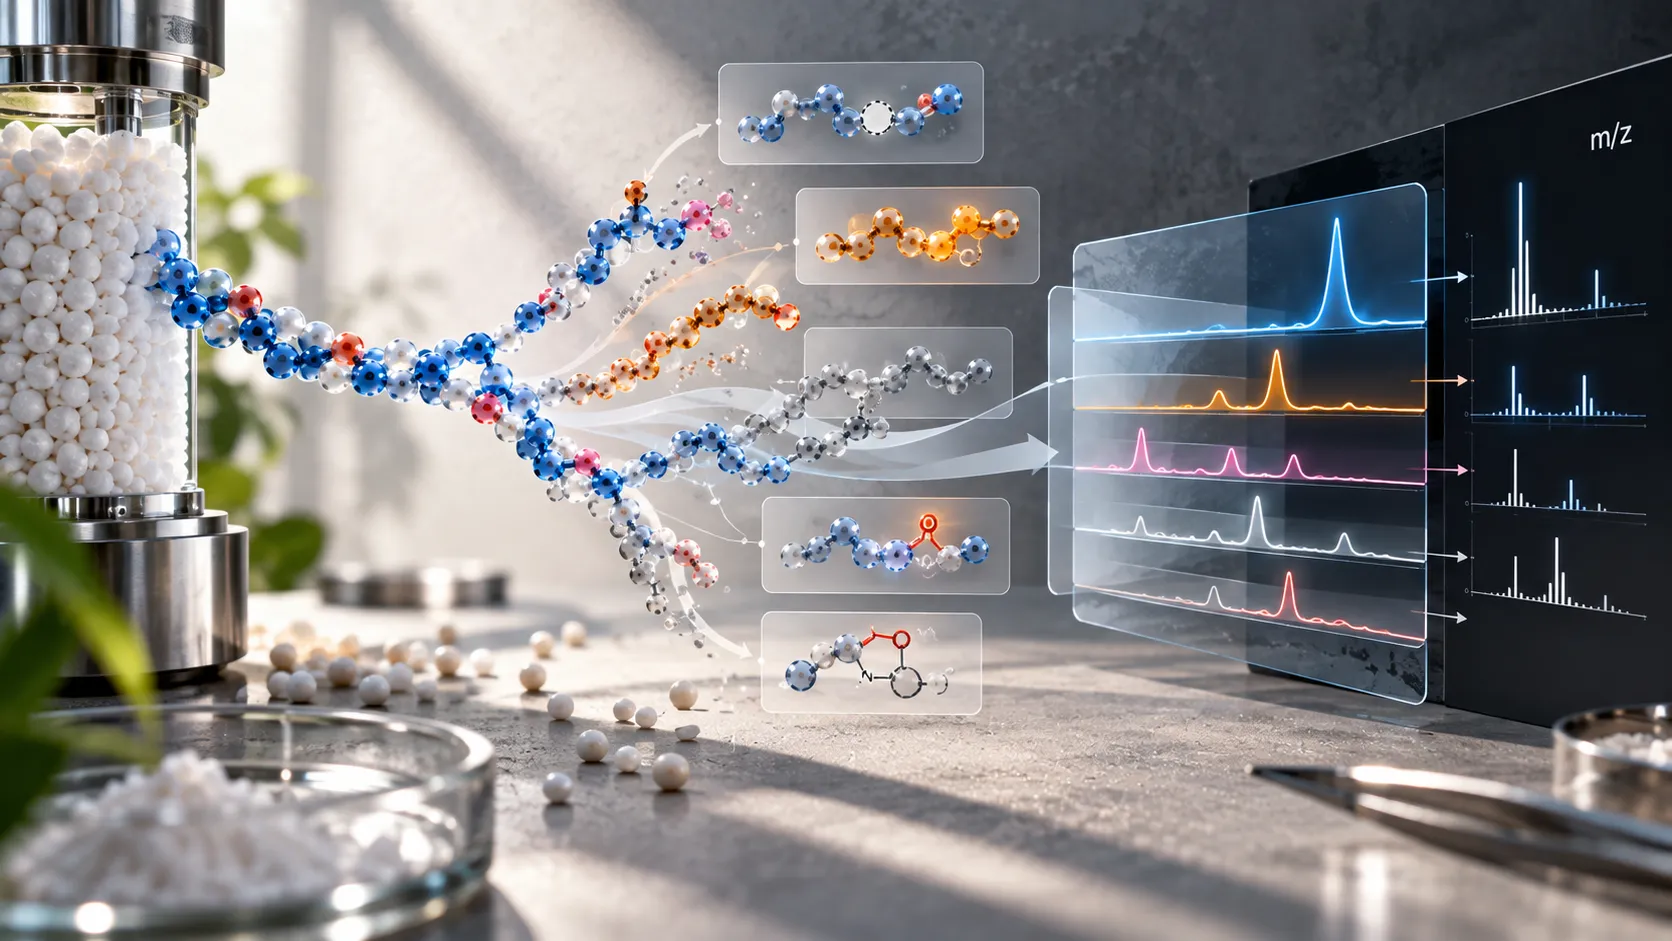
That leftover material is where peptide impurities come from. LC-MS is the method that tells one of them from another.
Read on for where each impurity class forms during synthesis and cleavage. You will also see why a 99% HPLC figure can sit on top of a hidden relative of your target. The last sections cover what a mass number on a Certificate of Analysis actually proves.
Quick answer. Peptide impurities come mostly from incomplete or unwanted chemical steps during synthesis and cleavage. HPLC shows how clean the main peak looks. LC-MS assigns a mass to each peak. That identifies most impurities, but not the ones weighing the same as the target.
How is a peptide made in the lab?
Most research peptides are made by solid-phase peptide synthesis, or SPPS. The chain grows while anchored to a resin bead, one residue at a time, in repeating cycles.
Robert Bruce Merrifield published the idea in 1963. His original research paper appeared in the Journal of the American Chemical Society. He anchored the first amino acid to an insoluble resin. Reagents and by-products could then be washed away by filtration instead of recrystallized. That single change made long sequences practical.
Each cycle runs three steps. A base removes the temporary protecting group from the growing chain's free end. The next protected amino acid is activated and coupled on. Solvent washes then carry away excess reagent before the cycle repeats.
Fmoc chemistry is the common modern version of this. Fmoc is a protecting group that blocks the amino end until the chemist wants it open. A mild base removes it each cycle, which is gentler than the older acid-based route.
At the end, a strong acid does two jobs at once. It cuts the finished chain off the resin. It also strips the side-chain protecting groups that kept reactive residues out of trouble during assembly. Crude peptide comes out of that step and then goes to purification.
The arithmetic is worth running once. At 99% efficiency per cycle, a 30-residue chain finishes intact about 74% of the time. At 99.9% it finishes about 97% of the time. Small shifts in coupling efficiency move the impurity load a long way.
Nothing in that description is exotic. The difficulty is arithmetic. SPPS impurities accumulate because every cycle is slightly imperfect. The chain carries each mistake forward to the end.
Where do peptide impurities come from?
Peptide impurities come from four places. Steps that did not finish, steps that happened twice, side reactions during cleavage, and chemical changes to finished material.
A deletion sequence is a chain missing one internal residue because a coupling step failed. These are often called n-1 impurities, since the product has one fewer residue than the target. Deletion sequences in peptide synthesis are the family most likely to hide in plain sight.
Truncation works differently. The chain stopped early and never reached full length, usually because a reactive end was capped or blocked. Truncated peptide sequences weigh much less than the target, so they are easy to spot by mass.
Insertion is the mirror image of deletion. One residue couples twice within a single cycle, adding an extra copy. The mass goes up by exactly one residue mass.
Chemical changes make up the rest. Methionine picks up an oxygen. Asparagine or glutamine loses an amide group. An aspartic acid residue can close into a ring and lose water. A 2014 review in the Journal of Pharmaceutical and Biomedical Analysis catalogues these classes across peptide medicines.
Timing separates the two groups. Deletion, truncation and insertion all happen while the chain is still on the resin. Oxidation, deamidation and pyroglutamate formation can happen later, in storage or in solution. A batch can therefore drift after the day it was tested.
Impurity | How it forms | Mass shift from target, monoisotopic (Da) | Best seen by |
|---|---|---|---|
Deletion sequence (n-1) | A coupling step fails and one internal residue is missing | Minus one residue mass, for example 57.021 for glycine | LC-MS |
Truncation | The chain stops early and never reaches full length | Large negative shift, size depends on what is missing | HPLC and LC-MS |
Insertion | One residue couples twice in the same cycle | Plus one residue mass | LC-MS |
Methionine oxidation | The methionine sulfur picks up an oxygen | +15.995 | HPLC and LC-MS |
Deamidation of Asn or Gln | A side-chain amide converts to an acid | +0.984 | LC-MS |
Aspartimide formation | An aspartic acid residue cyclizes and loses water | -18.011 | LC-MS |
Pyroglutamate from N-terminal Gln | N-terminal glutamine cyclizes and loses ammonia | -17.027 | LC-MS |
Residual tert-butyl group | Cleavage fails to remove a side-chain protecting group | +56.063 | LC-MS |
Racemization (epimer) | A residue flips from L to D during coupling | 0.000 | Neither one alone |
All shifts in that table are monoisotopic. Check them against a mass-spectrometry modification reference such as Unimod before quoting them in a report.
Two rows deserve a second look. The deamidation shift of 0.984 Da is smaller than the mass of one hydrogen atom. The racemization row shifts nothing at all, which is the whole problem with trusting mass on its own.
Why can HPLC purity look great while an impurity hides?
HPLC purity looks great because the number describes one peak's share of the UV signal. It does not describe the sample's true composition. Anything leaving the column at the same moment as the target is counted with it.
Reversed-phase HPLC separates species by how strongly each one sticks to the column. A deletion sequence missing a small residue behaves almost like the full-length chain. Its retention time can land within seconds of the main peak.
When that happens, the two species co-elute. The chromatogram shows one peak with a slight shoulder, or with no shoulder at all. Integration software draws a single boundary and reports a single area.
Here is an illustration rather than a measured result. Suppose a sample holds 1.5% of a co-eluting deletion sequence plus 0.5% of well separated impurities. The report reads 99.5% for the main peak. That 1.5% did not vanish, and it was never separated in the first place.
UV area percent is also not mass percent. Detection near 214 nm responds mainly to the peptide bond, so chains of different lengths absorb differently. A short truncation product gives less signal per microgram than the full-length target.
Resolution is what decides the outcome. A column and gradient tuned for the target may not separate its n-1 relative at all. Changing the organic modifier or lengthening the gradient sometimes pulls the two apart. That is one reason method details belong on the document.
Two habits follow from this. Read the chromatogram, not only the headline number. Check whether the method states its wavelength, and whether any peak carries a visible shoulder. It is one of several reasons purity figures deserve a closer read.
What does LC-MS confirm that HPLC cannot?
LC-MS confirms that the material under a given peak weighs what the target should weigh. HPLC only reports how cleanly that peak separated from everything else.
Two instruments work in series here. The liquid chromatograph separates the sample in time. The mass spectrometer measures the mass-to-charge ratio of whatever leaves the column at each moment.
That pairing gives you a mass for every peak. Match the measured mass to the calculated mass of the intended sequence. That gives you peptide identity confirmation at the level of composition. Minor peaks can often be assigned too. Subtract the target mass and read the difference against a table like the one above.
The HPLC vs LC-MS question for peptides comes down to one word. HPLC counts. LC-MS names.
What LC-MS does not prove is the order of the residues. Molecular mass is a sum of parts. Swap two residues along the chain and the sum stays exactly where it was.
A related detail trips people up. Peptides ionize with more than one proton attached, so a single species shows up at several mass-to-charge values. Each charge state should calculate back to the same molecular mass. A COA that lists them is easier to audit. The same document should also separate purity from content, a distinction covered in net peptide content versus HPLC purity.
What can LC-MS still miss?
LC-MS misses anything that weighs the same as the target, and anything too faint to detect. Both cases turn up often enough to matter.
Same-mass species are the first blind spot. An epimer has one residue flipped from L to D, so the atoms and the mass are identical. Leucine and isoleucine are isobaric, meaning they share a formula and therefore a mass.
Sequence swaps sit in the same group. Move two residues and the total does not change. The peak then looks correct at every level a mass number can reach.
Species that share the target's mass, such as epimers and isobaric residue swaps, cannot be resolved by mass alone. Chiral amino acid analysis, MS/MS, or an orthogonal separation is needed to tell them apart.
Abundance is the second blind spot. A species below the detection floor of the method simply does not appear. Pushing that floor lower usually costs run time or sample.
Ion suppression is the third. When an abundant peak and a faint one enter the source together, the big one takes most of the charge. The minor species then reads smaller than it is, or drops out of view entirely.
Some compounds also ionize poorly by nature. Very hydrophobic sequences, and species without a basic residue, can give weak signal in positive mode. That is why identity evidence usually pairs LC-MS with other data.
How much mass accuracy is enough?
Enough accuracy means a window tight enough to separate the modifications you care about. A 1 Da window on a 3,000 Da peptide works out near 333 ppm. That is wide enough to hide several of them.
Peptide mass accuracy is normally stated in one of two ways. Either as parts per million of the measured mass, or as a fixed window in daltons. The two behave very differently as peptides get larger.
Stated tolerance | Window on a 1,000 Da peptide | Window on a 3,000 Da peptide |
|---|---|---|
5 ppm | 0.005 Da | 0.015 Da |
0.1% (1,000 ppm) | 1 Da | 3 Da |
1 Da fixed window | 1 Da | 1 Da |
Run the deamidation case through that table. Its monoisotopic shift is 0.984 Da. At 5 ppm on a 3,000 Da peptide the window is 0.015 Da, so a 0.984 Da difference is unmistakable. Inside a fixed 1 Da window the same difference passes as a match.
Resolution is the related idea. Low-resolution instruments report masses to roughly whole numbers and work with tolerances near 1 Da. High-resolution instruments report several decimal places and operate in the single-digit ppm range. Only the second kind can resolve a sub-dalton shift with confidence.
Write the measured mass and the theoretical mass side by side in your notes, then subtract. A difference you can name, such as 15.995 or 0.984, tells you far more than a pass or fail stamp.
One omission is easy to overlook. A document that reports a measured mass but states no tolerance has given you half a result. Ask for the accuracy figure in ppm or Da.
How does MS/MS confirm a sequence?
MS/MS confirms sequence order by breaking the peptide apart and weighing the pieces. Gaps between the fragment masses spell out the residues in order.
The instrument first selects one ion of interest out of the full spectrum. That ion is then given energy, usually through collision with a gas. Peptide backbones break most readily at the amide bond.
Two fragment series come out of this. B ions carry the front of the sequence, counted from the N-terminus. Y ions carry the back, counted from the C-terminus. Subtract one b ion from the next and the difference equals a single residue mass.
Work along the series and the order falls out. Glycine shows up as a 57.021 Da gap. Alanine shows up as 71.037 Da. A gap matching no standard residue points to a modification at that position.
One more point about those fragment ions. Not every backbone bond breaks with equal probability, so some gaps go missing. Proline fragments unevenly in particular, which leaves holes in the ladder. A sequence read that looks complete may still rest on partial coverage.
MS/MS has its own limits. Leucine and isoleucine produce identical gaps under standard fragmentation. Coverage is often partial, so some stretches of the chain go unconfirmed.
Amino acid analysis answers a different question and is worth knowing about. It hydrolyzes the peptide and counts residues by type. It confirms composition without confirming order, and it can separate leucine from isoleucine where MS/MS cannot.
Routine COAs usually leave MS/MS out. Identity is commonly stated from intact mass alone. Where sequence-level evidence matters to your work, ask whether it was run and request the data.
What should a COA include to show identity and purity?
A COA should carry enough information for you to re-derive its conclusion. That means the underlying evidence, the method, the numbers, and the names behind them.
- A chromatogram, or a peak table with retention times and peak areas
- The UV wavelength used for detection
- The measured mass and the theoretical mass, written out separately
- The mass accuracy, stated in ppm or in Da
- The charge states observed, since peptides ionize at several
- A lot number that matches the label on the vial in front of you
- The named method, including column and gradient conditions
- The testing party, whether an in-house laboratory or a third party
- The date the testing was performed
Technique | What it answers | What it misses |
|---|---|---|
HPLC-UV | How much of the UV signal sits under the main peak | Co-eluting species, and true mass percent |
LC-MS | What mass sits under each separated peak | Sequence order, and same-mass species |
MS/MS | The order of residues along the chain | Leucine versus isoleucine, and uncovered stretches |
Amino acid analysis | Which residues are present, and in what ratio | The order in which they are joined |
Pharmacopoeial documents describe how impurities are characterized for pharmaceutical peptides. USP General Chapter 1503, Quality Attributes of Synthetic Peptide Drug Substances, became official in 2021. It sets out the quality attributes and test methods to consider for synthetic peptide drug substances. Research-grade material falls outside that chapter, since it is not a drug substance. The attribute list still works as a yardstick when you read a COA. The same goes for how HPLC purity is reported.
How do I read the mass line on my next COA?
First, find the measured mass and the theoretical mass, then subtract one from the other. A difference of zero is what you want. A difference of 15.995 or 0.984 has a name, and that name belongs in your notes.
Second, check the stated tolerance. Without a ppm or Da figure printed next to the mass, the match is not something you can audit.
Third, look at the chromatogram instead of the purity number alone. Shoulders, tailing, and a main peak wider than its neighbors all hint that something is co-eluting.
Every Longevia batch is independently HPLC/LC-MS tested, and lot-specific COAs are published in the COA Library.
For laboratory research use only. Not for human or veterinary use. Not intended to diagnose, treat, cure, or prevent disease.
Frequently Asked Questions
- Merrifield RB. Solid Phase Peptide Synthesis. I. The Synthesis of a Tetrapeptide. Journal of the American Chemical Society. 1963;85(14):2149-2154. Original research paper.
- D'Hondt M, Bracke N, Taevernier L, Gevaert B, Verbeke F, Wynendaele E, De Spiegeleer B. Related impurities in peptide medicines. Journal of Pharmaceutical and Biomedical Analysis. 2014;101:2-30. Review.
- McCarthy D, Han Y, Carrick K, Schmidt D, Workman W, Matejtschuk P, Duru C, Atouf F. Reference Standards to Support Quality of Synthetic Peptide Therapeutics. Pharmaceutical Research. 2023;40(6):1317-1328. Review.
- United States Pharmacopeia. General Chapter 1503, Quality Attributes of Synthetic Peptide Drug Substances. USP-NF, official 1 August 2021. Pharmacopoeial standard.
- Creasy DM, Cottrell JS. Unimod: Protein modifications for mass spectrometry. Proteomics. 2004;4(6):1534-1536. Analytical-method paper and reference database for monoisotopic mass shifts.