- HPLC purity is the main peak area divided by the total detected peak area.
- Net peptide content is the share of the dry powder mass that is peptide.
- A peptide can be 99% pure by HPLC and still be well under 100% peptide by weight.
- Counterion and residual water account for most of the non-peptide mass in a lyophilized vial.
- Purity comes from reversed-phase HPLC, and net content from amino acid analysis or elemental analysis.
- Treating 10.0 mg of powder at 80% net content as 10.0 mg of peptide overstates the peptide by 25%.
- A COA is more useful when it names a method beside every figure and reports measured values.
- USP General Chapter 1503 lists quality attributes for synthetic peptide drug substances and reads well as a checklist.
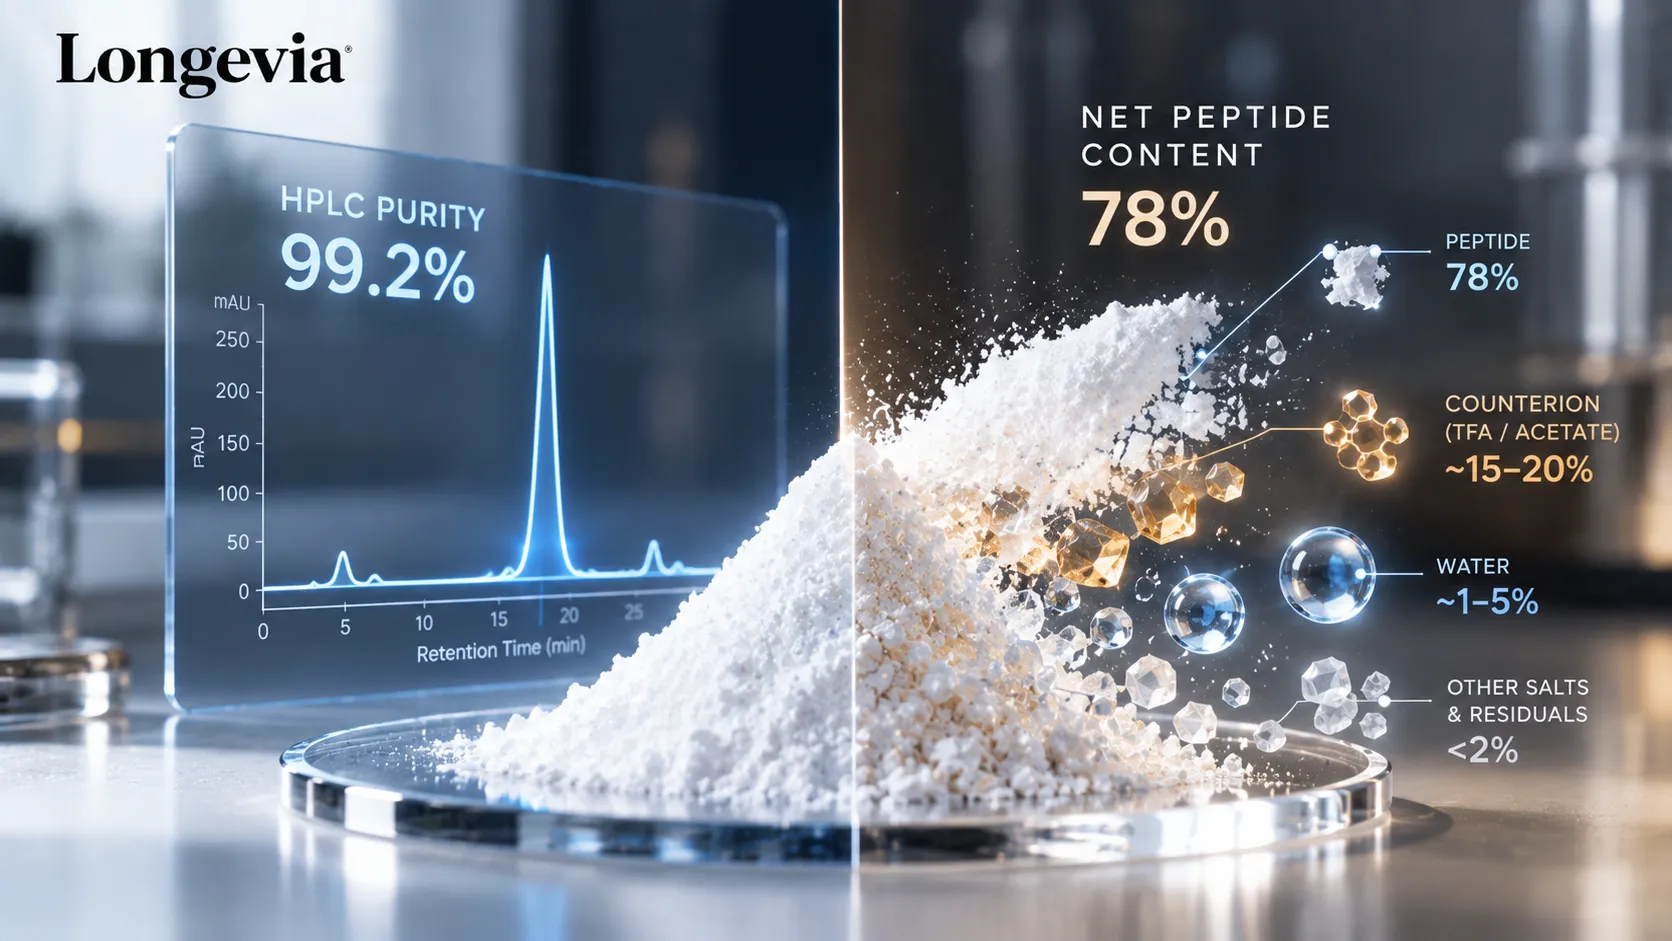
A certificate of analysis lists 99.2% HPLC purity. Four lines down, the same page lists 78% peptide content. One of those numbers looks wrong.
Neither is. The net peptide content vs purity puzzle appears because the two figures answer different questions about one vial. One describes the peptide. The other describes the powder.
This article covers what each number counts, how they combine in plain mass arithmetic, and what a COA should show. By the end you will be able to read both figures. You will know what the powder in front of you contains.
HPLC purity is the share of the peptide that is the correct sequence. Net peptide content is the share of the dry powder that is peptide at all. The rest is counterion, water, and small amounts of salt.
What does HPLC purity actually measure?
HPLC purity is the area of the main peak divided by the total area of all detected peaks. It describes the chromatogram, not the vial by mass.
Sample goes onto a reversed-phase column dissolved in solvent. Different species leave the column at different times. A UV detector records each one as a peak, and software integrates the area under every peak.
Detection for peptides is commonly set near 214 nm. The peptide bond absorbs light at that wavelength, which is the reason for the choice. Kuipers and Gruppen measured that absorbance in an analytical-method paper. They report 923 per molar per centimeter for the peptide bond at 214 nm.
Relative is the key word. A purity figure compares the target peak against everything else the detector managed to see. Whatever sits outside that view is never counted at all.
Plenty sits outside it. Water gives no useful signal at 214 nm. Most inorganic salts give none either. Counterions such as acetate absorb weakly, and a species that never elutes is never integrated.
Two more limits belong on the same list. An impurity that leaves the column at the same time as the target hides inside the main peak. A peak below the integration threshold is dropped before the percentage is calculated.
Read a stated 99.2% with all that in mind. The main peak held 99.2% of the detected peak area on that run, under that method, at that wavelength. The figure says nothing about how much of the powder in the vial was peptide.
What is net peptide content?
Net peptide content is the percentage of the dry powder's mass that is peptide. A COA reporting 78% net content says that 78% of the weighed powder is peptide. The other 22% is something else.
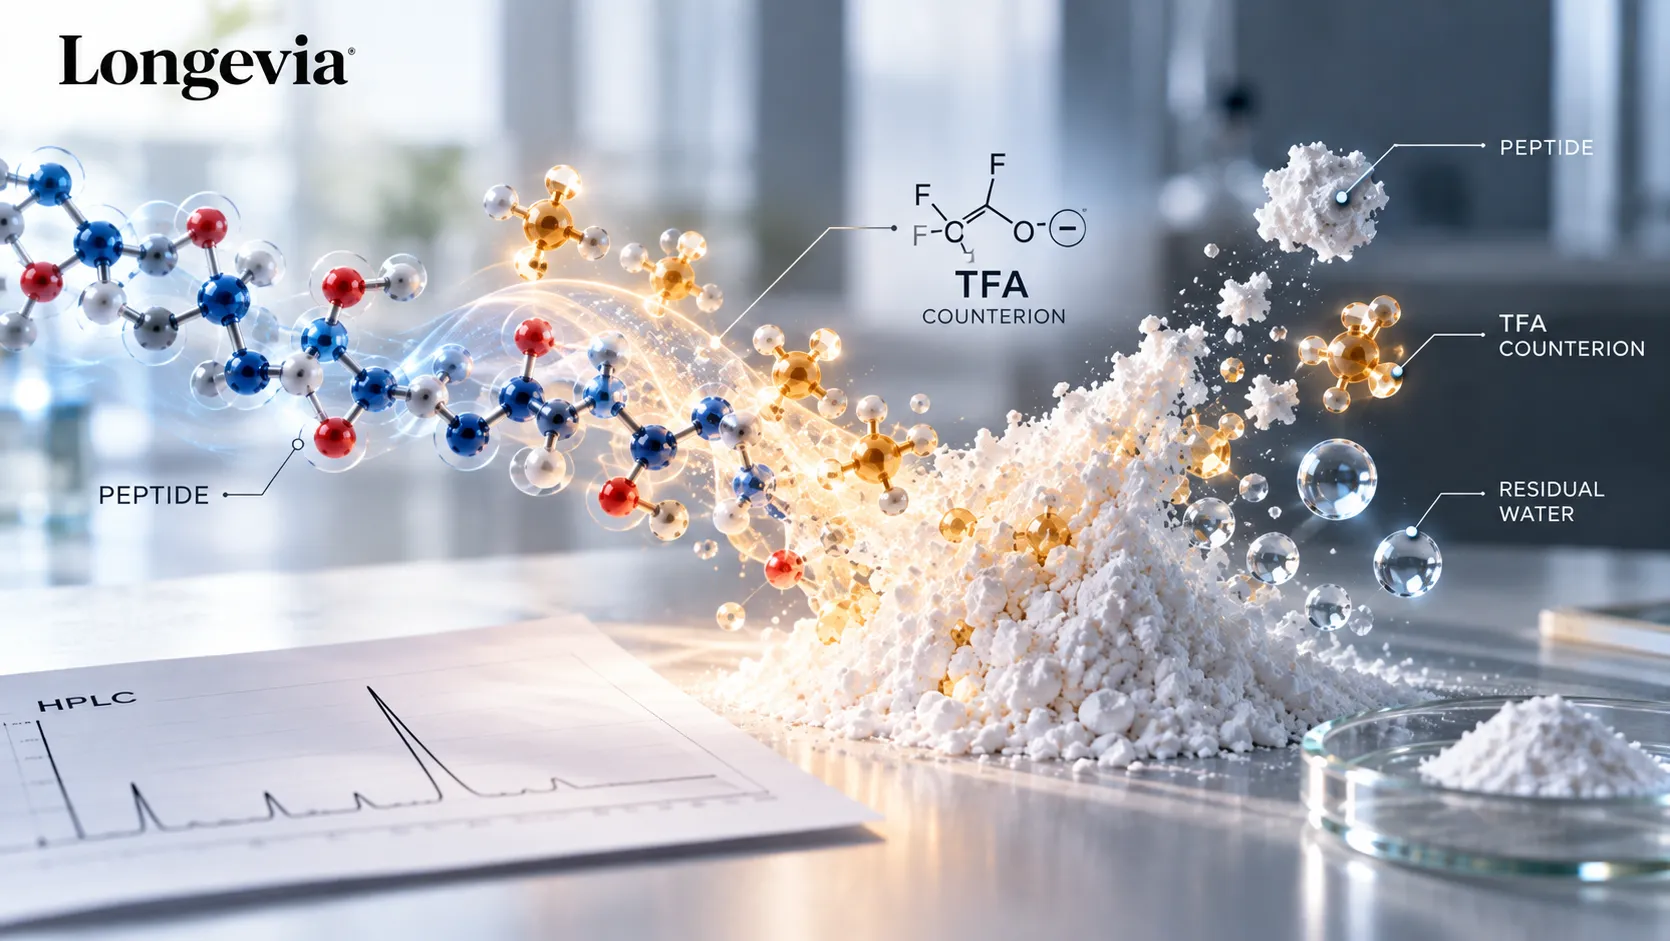
Counterion and water make up most of that something else. Small amounts of inorganic salt and residual solvent can sit in the cake too.
Counterions arrive with the chemistry. Solid-phase peptide synthesis uses trifluoroacetic acid to cleave the peptide and as an ion-pairing reagent during purification. Peptides from that route are often isolated as TFA salts. Erckes and colleagues describe this in a 2025 analytical-method paper.
Charged side chains hold those counterions in place. A sequence carrying several positive charges pairs with more counterion. Net content falls as a result, even when the material is clean. TFA has a formula weight near 114, so a few equivalents add real mass. Acetate is the other counterion seen often, usually after a salt exchange step.
Water is the second contributor. Freeze-drying removes most of the water and not all of it. Lin and Hsu reported residual moisture around 1% to 5% in a lyophilized protein product. They measured it by Karl Fischer titration and near-infrared spectroscopy, in an analytical-method paper.
Lyophilized material also has a large surface area. A porous cake takes up moisture from room air whenever a vial is opened and left sitting. Hygroscopic sequences do this faster than others.
Sequence and salt form therefore set the number. Net peptide content for synthetic peptides sits well below 100% as a rule, and no single figure covers every peptide. Treat the value on a COA as belonging to that lot and nothing else.
How can a peptide be 99% pure and still be only 80% peptide by weight?
Both figures describe different slices of the same material. Net content divides the powder into peptide and non-peptide. Purity then describes what sits inside the peptide slice.
The table below uses illustrative numbers, not any specific product.
Item | Value | How it is derived |
|---|---|---|
Gross powder mass | 10.0 mg | Balance reading |
Net peptide content | 80% | From amino acid analysis |
Peptide mass | 8.0 mg | 10.0 x 0.80 |
Counterion and water | 2.0 mg | 10.0 minus 8.0 |
HPLC purity by area | 99% | Main peak / total peak area |
Target-sequence peptide | about 7.92 mg | 8.0 x 0.99 |
Related peptide impurities | about 0.08 mg | 8.0 minus 7.92 |
Read it as a sequence of steps. The balance reads 10.0 mg of powder. Net peptide content of 80% means 8.0 mg of that is peptide, which leaves 2.0 mg of counterion and water.
Purity applies inside the peptide fraction only. Area purity of 99% on 8.0 mg of peptide gives about 7.92 mg of the target sequence. The remaining 0.08 mg is related peptide material, such as deletion or truncated sequences.
Nothing here contradicts anything else. A number near 99 and a number near 80 have different denominators. One counts peak area, the other counts milligrams of powder.
Run the logic backwards and it still holds. If you need 8.0 mg of peptide from this lot, you weigh 10.0 mg of powder. The purity figure does not change that first calculation at all.
Notice what the purity figure never touched. It said nothing about the 2.0 mg of counterion and water. Purity had no opportunity to change the split between peptide and non-peptide.
Precision deserves a short note. Figures above are rounded for readability, and carrying more decimal places changes nothing important. Extra digits will not rescue a net content value that was never reported.
One caveat belongs with the arithmetic. Area percent approximates mass fraction rather than matching it exactly, because species absorb UV at different strengths. The same analytical-method paper found tryptophan absorbing roughly 30 times more strongly at 214 nm than a peptide bond.
Purity is a property of the peptide. Content is a property of the powder.
How are purity and net peptide content measured?
Each attribute has its own method, and a COA should name the method beside the figure. No single instrument reports all of them.
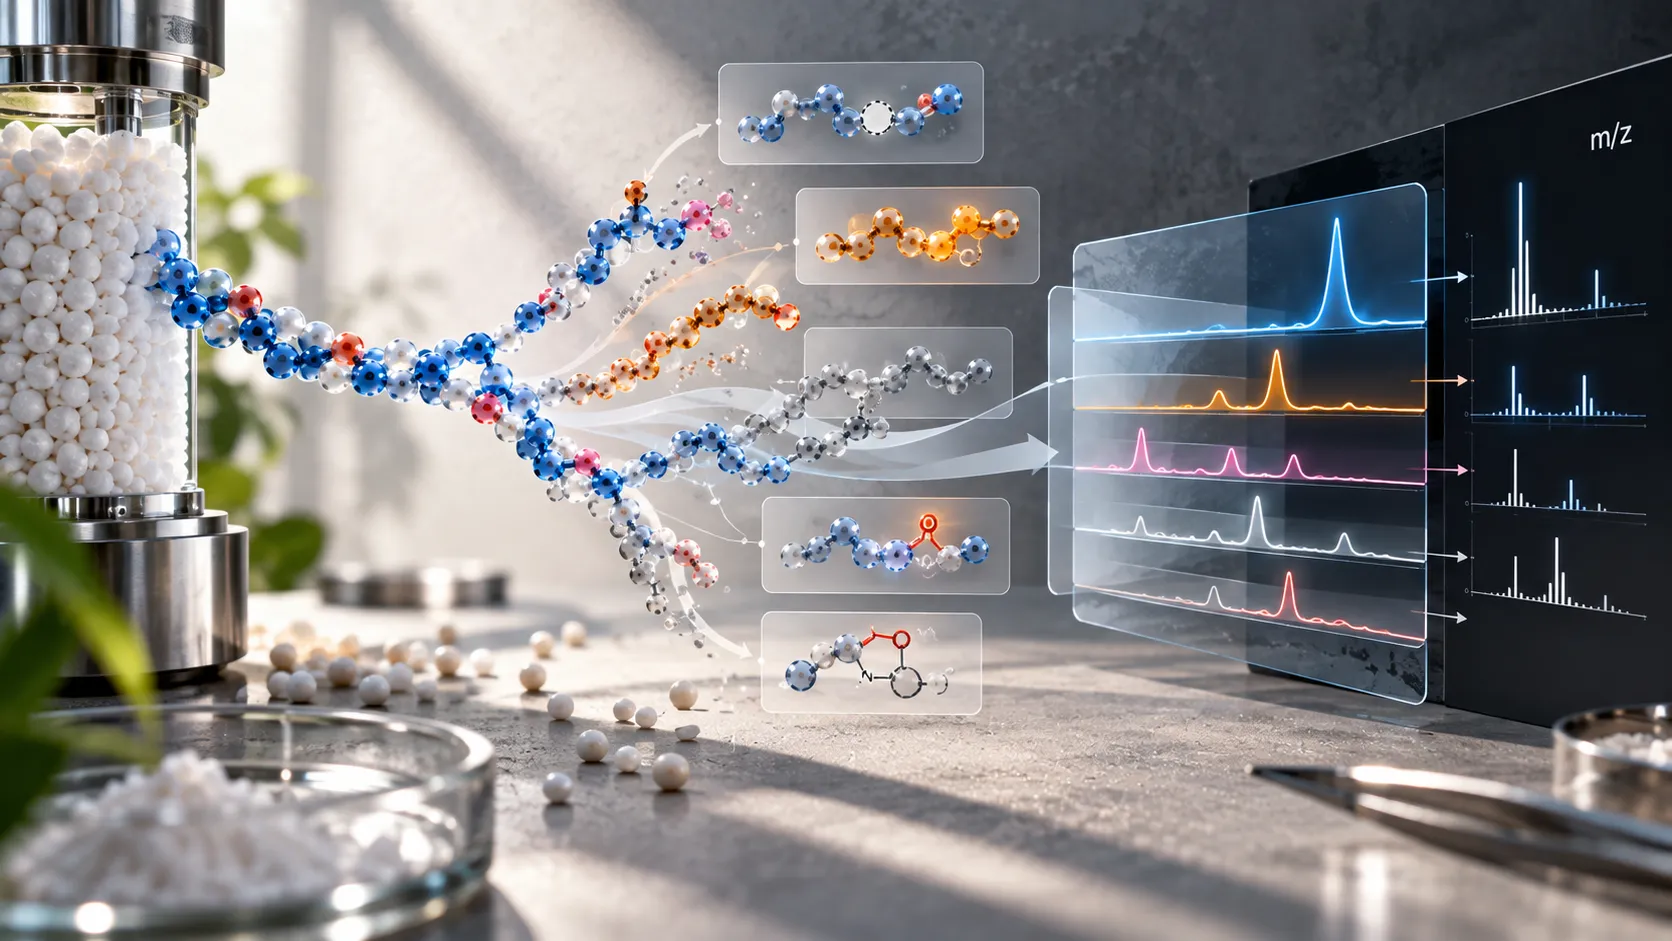
Purity comes from reversed-phase HPLC with UV detection. That answers how much of the detected peptide material is the target sequence. Identity comes from mass spectrometry, which answers whether the molecule weighs what the sequence predicts.
Mass accuracy matters in that second answer. A result quoted with a wide tolerance can accommodate sequences that differ by a residue. A stated observed mass and expected mass is more useful than a pass mark.
Net peptide content comes from quantitative amino acid analysis or from elemental analysis. Amino acid analysis hydrolyzes the peptide in strong acid, then separates and quantifies the released amino acids against a standard. Elemental analysis measures nitrogen instead, so it works without knowing the sequence. Both consume the sample.
Water is measured by Karl Fischer titration, which is built on the reaction of iodine with water. USP describes water determination in General Chapter 921, a pharmacopoeial standard. Counterion content needs a separate test again. Erckes and colleagues validated fluorine-19 NMR, HPLC with evaporative light-scattering detection, and FT-IR for residual trifluoroacetate.
Orthogonal methods are the reason for the long list. Each technique probes a different property of the same material. Agreement between two independent methods is worth more than one confident number.
Amino acid analysis carries a quirk worth knowing. The method is sequence specific, since released amino acids are compared against what the sequence predicts. Elemental nitrogen analysis makes no such assumption, which is why some labs run it instead.
Term | What it tells you | Typical method | What it cannot tell you |
|---|---|---|---|
HPLC purity | Share of detected peptide that is the target sequence | Reversed-phase HPLC, UV near 214 nm | How much of the powder is peptide |
Mass spec identity | Whether the observed mass matches the sequence | LC-MS or MALDI-TOF | How much target is present by mass |
Net peptide content | Share of the powder mass that is peptide | Quantitative amino acid analysis, or elemental analysis | Which peptide species are present |
Water content | Share of the powder mass that is water | Karl Fischer titration | Anything about sequence or purity |
Counterion content | Share of the powder mass that is counterion | Fluorine-19 NMR, ion chromatography, HPLC-ELSD | Anything about peptide identity |
Look down the last column of that table. Every method has a blind spot, which is why one figure never describes a vial on its own.
What do gross weight, net weight, and mass balance mean on a COA?
Gross weight is what the balance reads for the whole powder. Net peptide weight is the peptide fraction of that mass. Mass balance is the check that the parts add up to the whole.
Written out, mass balance says peptide plus counterion plus water plus other material equals 100%. Take the earlier example. Peptide at 80%, counterion and water together at 20%, and the sheet closes at 100%.
USP used that approach when assigning values to peptide reference standards. McCarthy and colleagues describe the two-step value assignment in a 2023 review. Bulk material gets a quantitative value by mass balance, then serves as the standard for the final vialed product.
A COA that reports purity, water and counterion but omits net content leaves the balance open. You can see some of the pieces without seeing the total.
The other bucket is the one people forget. Residual solvent, inorganic salt from a buffer exchange, and anything left after drying all live in it. A COA that never mentions that material has not shown it to be absent.
Reconciling a sheet is quick arithmetic. Add the reported non-peptide attributes, subtract from 100%, then compare the remainder against the stated net content. A gap of a few points is normal. A gap of fifteen points is a question for the supplier.
Run the check on the day the material arrives. A sheet is far easier to query then than halfway through a run.
Missing pieces are not the same as wrong numbers. A COA you cannot reconcile is usually incomplete rather than false. Ask the supplier for the attribute that is absent before drawing conclusions about the material itself.
Why does the difference matter in lab records?
Treating powder as pure peptide overstates the peptide mass, and the size of that error is easy to compute. Assume 10.0 mg of powder at 80% net content. The peptide mass is 8.0 mg, so calling it 10.0 mg overstates the amount by 2.0 mg.
Express the gap as a percentage. 2.0 divided by 8.0 is 0.25, which is a 25% overstatement of the peptide actually present. That is not a rounding difference.
Comparisons between lots break the same way. Two lots quoted on different bases are not comparable, and the same applies to two suppliers. Compare gross against gross, or net against net, never one against the other.
Reproducibility is the practical cost. A study that switches lots midway can switch net content without anyone noticing. The gross mass on the notebook page stays the same while the peptide mass moves.
Supplier comparisons carry the same trap. A cheaper vial quoted on gross mass can hold less peptide than a dearer one quoted on net mass. Price per milligram of powder and price per milligram of peptide are different figures.
One habit removes most of the risk. Record the net content value next to the lot, not only the peptide mass you derived from it. Keeping the raw inputs lets you redo the arithmetic later.
Records are where this gets fixed. Write down which basis each mass used, and write down the lot the figure came from. Steps beyond mass accounting sit outside the scope of this article.
Write "gross" or "net" beside every peptide mass in your notebook. Future you will not remember which one was meant.
What should a COA show so the numbers can be trusted?
A COA earns trust by naming methods and reporting measured values. Thresholds and unlabeled figures hide the information you need most.
Look for these items:
- Lot number that matches the label on the vial
- Named method beside every reported figure
- Measured values rather than thresholds such as 98% or better
- A chromatogram or a peak table, not a bare number
- Mass accuracy stated for the mass spectrometry result
- Net peptide content
- Water content
- Counterion identity and amount
- Date of testing
- Name of the party that ran the tests
Red flag | What it can hide |
|---|---|
Purity given only as a threshold | The measured value, which may sit just above the line |
No chromatogram attached | Peak shape, coeluting material, and the size of each impurity |
No net peptide content | How much of the powder is counterion and water |
No method named | Which technique produced the figure, and its blind spots |
Mass spec result with a wide tolerance | A sequence that differs from the target |
No lot number | That the document describes a different batch |
Thresholds deserve particular attention. A stated minimum tells you where the result cleared a line, not where it landed. A measured 95.4% and a measured 99.6% can both sit behind the same claim.
Lot numbers deserve the same scrutiny. A COA describes one batch of material. A document that does not match the vial in your hand describes a different batch. That mismatch is common and quiet.
Method names carry more weight than they look. HPLC purity at 214 nm and HPLC purity at 280 nm are not the same measurement. The second reads aromatic side chains, so it underreports peptides without tryptophan or tyrosine.
Test dates matter for a different reason. Peptides change slowly in storage, and a sheet from two years ago describes the material as it was then.
Absence is the broader signal. A COA can be honest and still be thin, and a thin COA leaves you doing arithmetic with missing terms. More on reading these documents sits in our guide to HPLC purity testing. Counterion and water get their own treatment in this companion piece.
Where does USP General Chapter 1503 fit in?
USP General Chapter 1503 describes quality attributes for synthetic peptide drug substances. It became official in 2021. The chapter covers identity, purity, peptide-related impurities, and other attributes of a peptide drug substance specification.
Scope matters here. The chapter addresses drug substances, and it leaves out drug product attributes and peptides made by recombinant DNA methods. Research material is not governed by it at all.
The chapter is useful anyway. Read as a checklist, its attribute list shows what a thorough peptide analysis looks like. A research COA reporting identity, purity, content, counterion and water answers the same questions.
Why the chapter exists is worth a line. Synthetic peptides sit between small molecules and biologics, so several older guidance documents exclude them. The European Medicines Agency published its own guideline on synthetic peptides. That regulatory document makes the same point about scope.
Research suppliers borrow the vocabulary either way. Terms such as peptide content, counterion and water content come out of this analytical tradition. A research COA using them is speaking a language you can check.
What the chapter does not provide is a pass mark for research material. It describes attributes and methods rather than one number every peptide must clear. Reading it as a list of questions works better than reading it as a specification.
Related chapters sit alongside it. USP lists amino acid analysis under General Chapter 1052 and water determination under General Chapter 921. Those are the compendial homes for two of the numbers discussed above. For background on why these attributes matter, see why peptide purity matters.
What should I do with this on my next COA?
Three steps turn all of this into practice.
- Find both numbers. Locate HPLC purity and net peptide content, and note the method printed beside each one.
- Do the mass arithmetic. Multiply gross powder mass by net content to get peptide mass. Then apply area purity inside that fraction.
- Record the basis. Write gross or net beside every figure, along with the lot number it came from.
Check what is missing while you are there. A COA without net content, a named method, or a chromatogram is telling you to ask questions.
Every Longevia batch is independently HPLC/LC-MS tested. Lot-specific Certificates of Analysis are published in the COA Library.
For laboratory research use only. Not for human or veterinary use. Not intended to diagnose, treat, cure, or prevent disease.
Frequently Asked Questions
- United States Pharmacopeia. General Chapter 1503, Quality Attributes of Synthetic Peptide Drug Substances. USP-NF (pharmacopoeial standard).
- United States Pharmacopeia. Peptide Standards and Solutions, listing General Chapters 1503, 1504, 1052 and 503 (pharmacopoeial standard).
- McCarthy D, Han Y, Carrick K, Schmidt D, Workman W, Matejtschuk P, Duru C, Atouf F. Reference Standards to Support Quality of Synthetic Peptide Therapeutics. Pharmaceutical Research. 2023;40(6):1317-1328 (review).
- Kuipers BJH, Gruppen H. Prediction of Molar Extinction Coefficients of Proteins and Peptides Using UV Absorption of the Constituent Amino Acids at 214 nm. Journal of Agricultural and Food Chemistry. 2007;55(14):5445-5451 (analytical-method paper).
- Erckes V, Streuli A, Chamera Rendueles L, Kramer SD, Steuer C. Towards a Consensus for the Analysis and Exchange of TFA as a Counterion in Synthetic Peptides and Its Influence on Membrane Permeation. Pharmaceuticals. 2025;18(8):1163 (analytical-method paper).
- Lin TP, Hsu CC. Determination of Residual Moisture in Lyophilized Protein Pharmaceuticals Using a Rapid and Non-Invasive Method, Near Infrared Spectroscopy. PDA Journal of Pharmaceutical Science and Technology. 2002;56(4):196-205 (analytical-method paper).
- European Medicines Agency. Guideline on the development and manufacture of synthetic peptides (regulatory document).